Winter is here (at least in the Northern hemisphere!) and with it comes days of howling winds and frigid temperatures that turn an unassuming backyard into a Hoth-esque landscape.
For more than a century, researchers have tried to quantify the extra misery that the cold, moving air inflicts on exposed skin, a.k.a. the Wind Chill Index. The first such index was borne from a study more than 80 years ago at an Army Base deep in the Antarctic Circle. Researchers took advantage of the extreme weather conditions to develop a model over a wide range of temperatures and wind speeds.
Three remarkable things about this study:
- Simple instrumentation
- Clever design
- Surprising durability
Let’s dig in!
Simple instrumentation
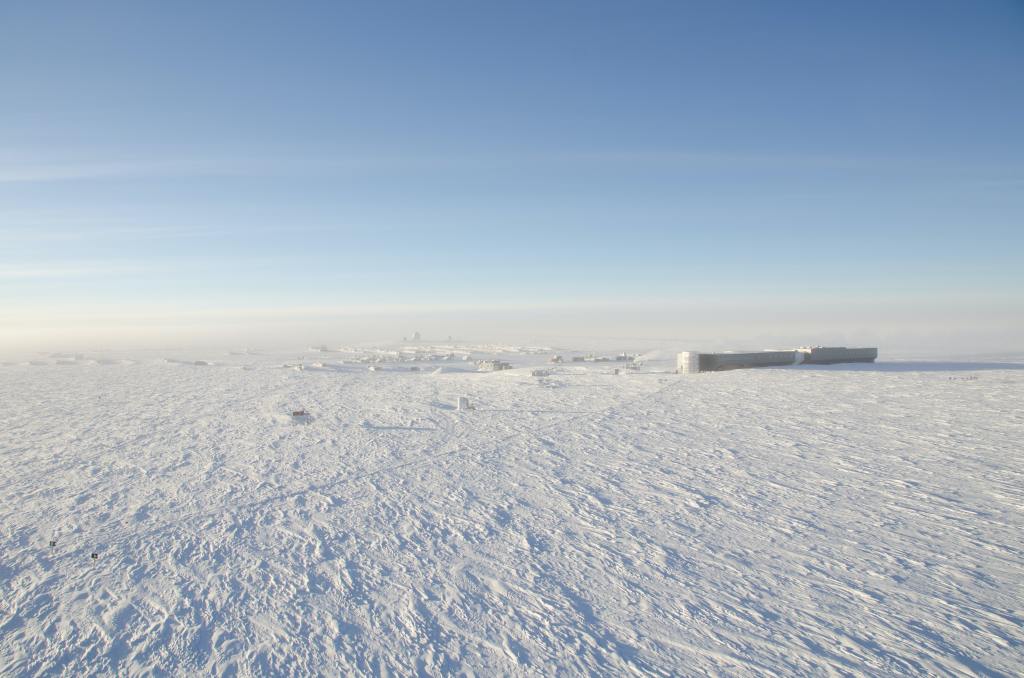
Paul Siple and Charles Passel were part of the United States Antarctic Service that explored regions near the South pole between 1939 and 1941. While stationed at “Little America” in 1941, they performed a study to determine rates of “atmospheric cooling” over a range of temperatures and wind speeds. Although there were implications for broader adoption, the immediate interest was to inform personnel of the risk of frostbite based on weather conditions.
Their experiment was surprisingly simple:
- They sealed a bottle with 250 grams of water and a thermometer and hung it from a pole
- Next to the bottle, they hung another thermometer and an anemometer to measure air temperature and wind speed
- Once set, they measured the time from when the water began to freeze (temperature just above 32°F) and when the water completely froze (temperature just below 32°F)
A water bottle, two thermometers, an anemometer, and a stopwatch. That’s it!
Since the energy needed to freeze 250 grams of water was known (heat of fusion = 79.71 calories per gram), they could calculate the heat loss by dividing the total heat released by the time it took to freeze the water.
For example:
- 250 grams of water freezes in 15 minutes (0.25 hours)
- (250 grams) x (79.71 calories/gram) = 19,925 calories lost
- 19,925 calories / 0.25 hours = 79,710 calories/hr = 79.71 kcal/hr
An important part of this work was making the results comparable to other research. No groups used identical experimental setups, so the cooling rate had to be generalizable by incorporating the surface area transferring heat from the water to the environment.
Using the example above, if the surface area was 0.5 square meters (m2) the cooling rate would be:
- (79.71 kcal/hr) / (0.5 m2) = 159.42 kcal/m2/hr
Another unit with 5 m2 surface area and heat loss of 797.1 kcal/hr would have the same cooling rate:
- (797.1 kcal/hr) / (5 m2) = 159.42 kcal/m2/hr
By using these units, the size of the apparatus does not matter. Cooling rates are all relative to one square meter.
Limited resources and instrumentation kept the setup simple but some ingenious experimental design and help from Mother Nature brought amazing value to the work.
Clever design
When building their experiment, Siple and Passel knew that the rate atmospheric cooling is affected by numerous factors:
- Air temperature
- Wind speed
- Conduction – heat transfer through direct contact (e.g. handwarmers)
- Radiation – heat transfer via electromagnetic waves (e.g. the sun)
- Evaporation – heat transfer from vaporizing water (e.g. sweating)
Focused on air temperature and wind speed, they needed to minimize the effects of the other factors they had no control over. Fortunately, the Antarctic tundra provided climatic consistencies to assist!
Incoming radiation: The sun’s rays beating down on Earth from 93,000,000 miles away add warmth to even the coldest environment. By running the experiments in the dead of winter, the sun was far below the horizon and had no effect.
Outgoing radiation: A strange fact about radiation is that any object with a temperature above absolute zero will radiate heat to objects at lower temperatures, even a bottle of freezing water. Published research at the time noted that heat loss from radiation changes linearly with each degree of temperature change. In other words, if the air gets 1 degree colder, the water radiates another ~4 kcal/hr. Two degrees colder, ~8 kcal/hr. And so on. Armed with this information, Siple and Passel adjusted their equations accordingly.
Humidity: Evaporating water is a remarkably effective way to transfer heat and could have significantly affected their experimental results. However, the frigid air near the South pole holds only a negligible amount of water vapor. The miniscule amount of evaporation that occurred near the testing apparatus did not significantly affect the results and was subsequently ignored.
The combination of these fortuitous factors minimized the effects of variables Siple and Passel could not control and maximized the value of the measured variables of air temperature and wind speed.
In total, Siple and Passel repeated their testing procedure 80+ times to build a mathematical model that correlated cooling rate with wind speed and air temperature:
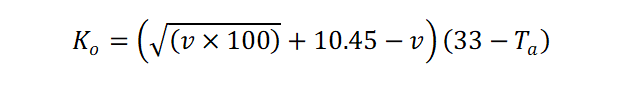
Where:
- Ko = Cooling rate in kcal/m2/hr
- v = wind speed in meters per second
- Ta = air temperature in °C
This formula generated a table of values that were somewhat esoteric. Yes, the bigger the number, the colder it feels outside, but how much colder?
This is where it gets crazy.
Siple, Passel, and their colleagues timed how long it took for faces to freeze! They stood bare-headed facing the wind while the medical officer waited for their skin to lose all color, which coincided with a sharp twinge of pain. In one experiment, 11 subjects had their noses frozen while standing in -26.6°F (-32.5°C) with 16 mph winds (2000 kcal/m2/hr on their scale). On average, it took a minute for noses to freeze, including Passel who froze his nose four times in the experiment. That’s dedication!
Based on similar experiments and other related research, they built a table with cooling rates ranging from 0 to 2600 kcal/m2/hr with corresponding comfort levels. Figure 1 is a heat map (or is it a cold map?) illustrating the degradation of conditions as the wind increases and air temperature decreases.
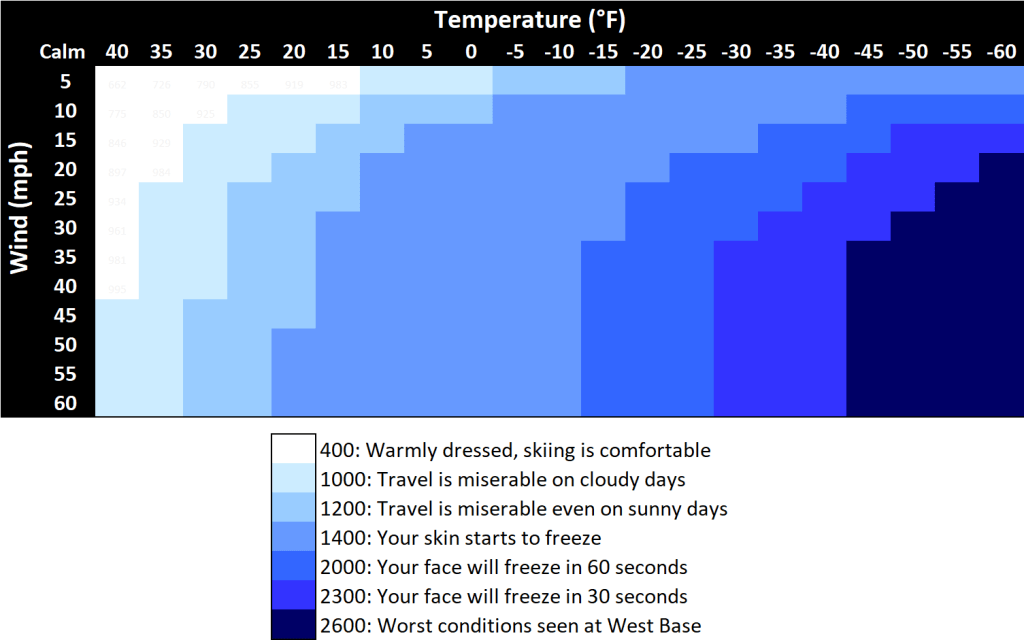
The dark blue section is beyond the worst conditions experienced by Siple and compatriots at West Base, which was noted was on September 4, 1940. Air temperatures dropped to between -58 to -65°F with winds of 11 to 16 mph, a cooling rate ~2600 kcal/m2/hr. Those conditions were abysmal, but on a later expedition to the South Pole, Siple recorded temperatures at -102°F on September 17, 1957, a deathly cooling rate of 3290 kcal/m2/hr.
Surprising durability
Siple and Passel’s model combined heat transfer theory and practical explanations to provide a great tool for Antarctic personnel. Reading air temperature and wind speed from the relative comfort of their shelter, they could gauge outdoor conditions, i.e. whether it was kind of dangerously cold or really dangerously cold outside. The model also gained broader acceptance in the meteorological community because it accomplished what others had failed to do: provide a simple way to gauge the coldness outside.
Variations of the model appeared through the years but it was not until 2001 before it was replaced by the present-day standard, more than 60 years after the original work!
The more highfalutin model calculates an “as feel” temperature instead of a cooling rate:
Wind Chill temperature = 35.74 + (0.6215 x T) – (35.75 x V0.16) + (0.4275 x T x V0.16)
Where:
- T = Air temperature in °F
- V = Wind speed in miles per hour
The end result is a more rigorous treatment of heat transfer effects on the human body than the Antarctic study but it took a loooooooong time to get there.
Conclusions
Amazing results can come from simple set-ups with thoughtful design. Siple and Passel crafted a robust experimental setup and took advantage of the consistent Antarctic climate to create a remarkably durable result.
The beauty of this work is that it would be straightforward (not easy!) to repeat their experiments and verify the results. Research is fraught with results that are not reproducible. With Siple and Passel’s set up clearly described and easily obtainable equipment, one could imagine a savvy student from Saskatchewan replicating their work for a school project.
All that said, the next time you hear a meteorologist mention the wind chill, keep in mind those hearty souls hunkered down in a remote Army base to do a little science.
Stay warm in these frosty times!
Gratitude
Thanks for reading! Comment below about what you liked (or didn’t!) or hit me up on Twitter.
Many thanks to the Foster crew, especially Russell and Christine – for the edits and suggestions.
They make my writing better and could do the same for you!
References and further reading
- More on the United States Antarctic Service Expedition from Wikipedia: https://en.wikipedia.org/wiki/United_States_Antarctic_Service_Expedition
- Siple and Passel’s 1945 paper: https://www.jstor.org/stable/985324
- Heat of fusion for water and other substances
- Wind Chill Chart from weather.gov
- More about Siple and Passel’s work and the development of the new Wind Chill standard. https://www.wemjournal.org/article/S1080-6032(21)00077-6/fulltext
- Department of Commerce report on developing the new Wind Chill Index. http://solberg.snr.missouri.edu/gcc/OFCMWindchillReport.pdf
- More about Paul Siple and his Antarctic adventures – https://www.south-pole.com/p0000111.htm
- More on the “Replication Crisis”, i.e. lack of independent verification of research – https://en.wikipedia.org/wiki/Replication_crisis
